Monitoring
Kamaji exposes metrics for both the management plane (Kamaji controllers) and Tenant Control Plane (TCP) components. Metrics are exposed in Prometheus format and can be scraped from the management cluster.
Prerequisites
Ensure you have installed the Prometheus Operator in the Management Cluster and that it is configured properly. You should verify that Service Monitor CRDs are installed in the Management Cluster as they are used to tell Prometheus how to scrape the metrics from the TCP.
Kamaji management-plane metrics
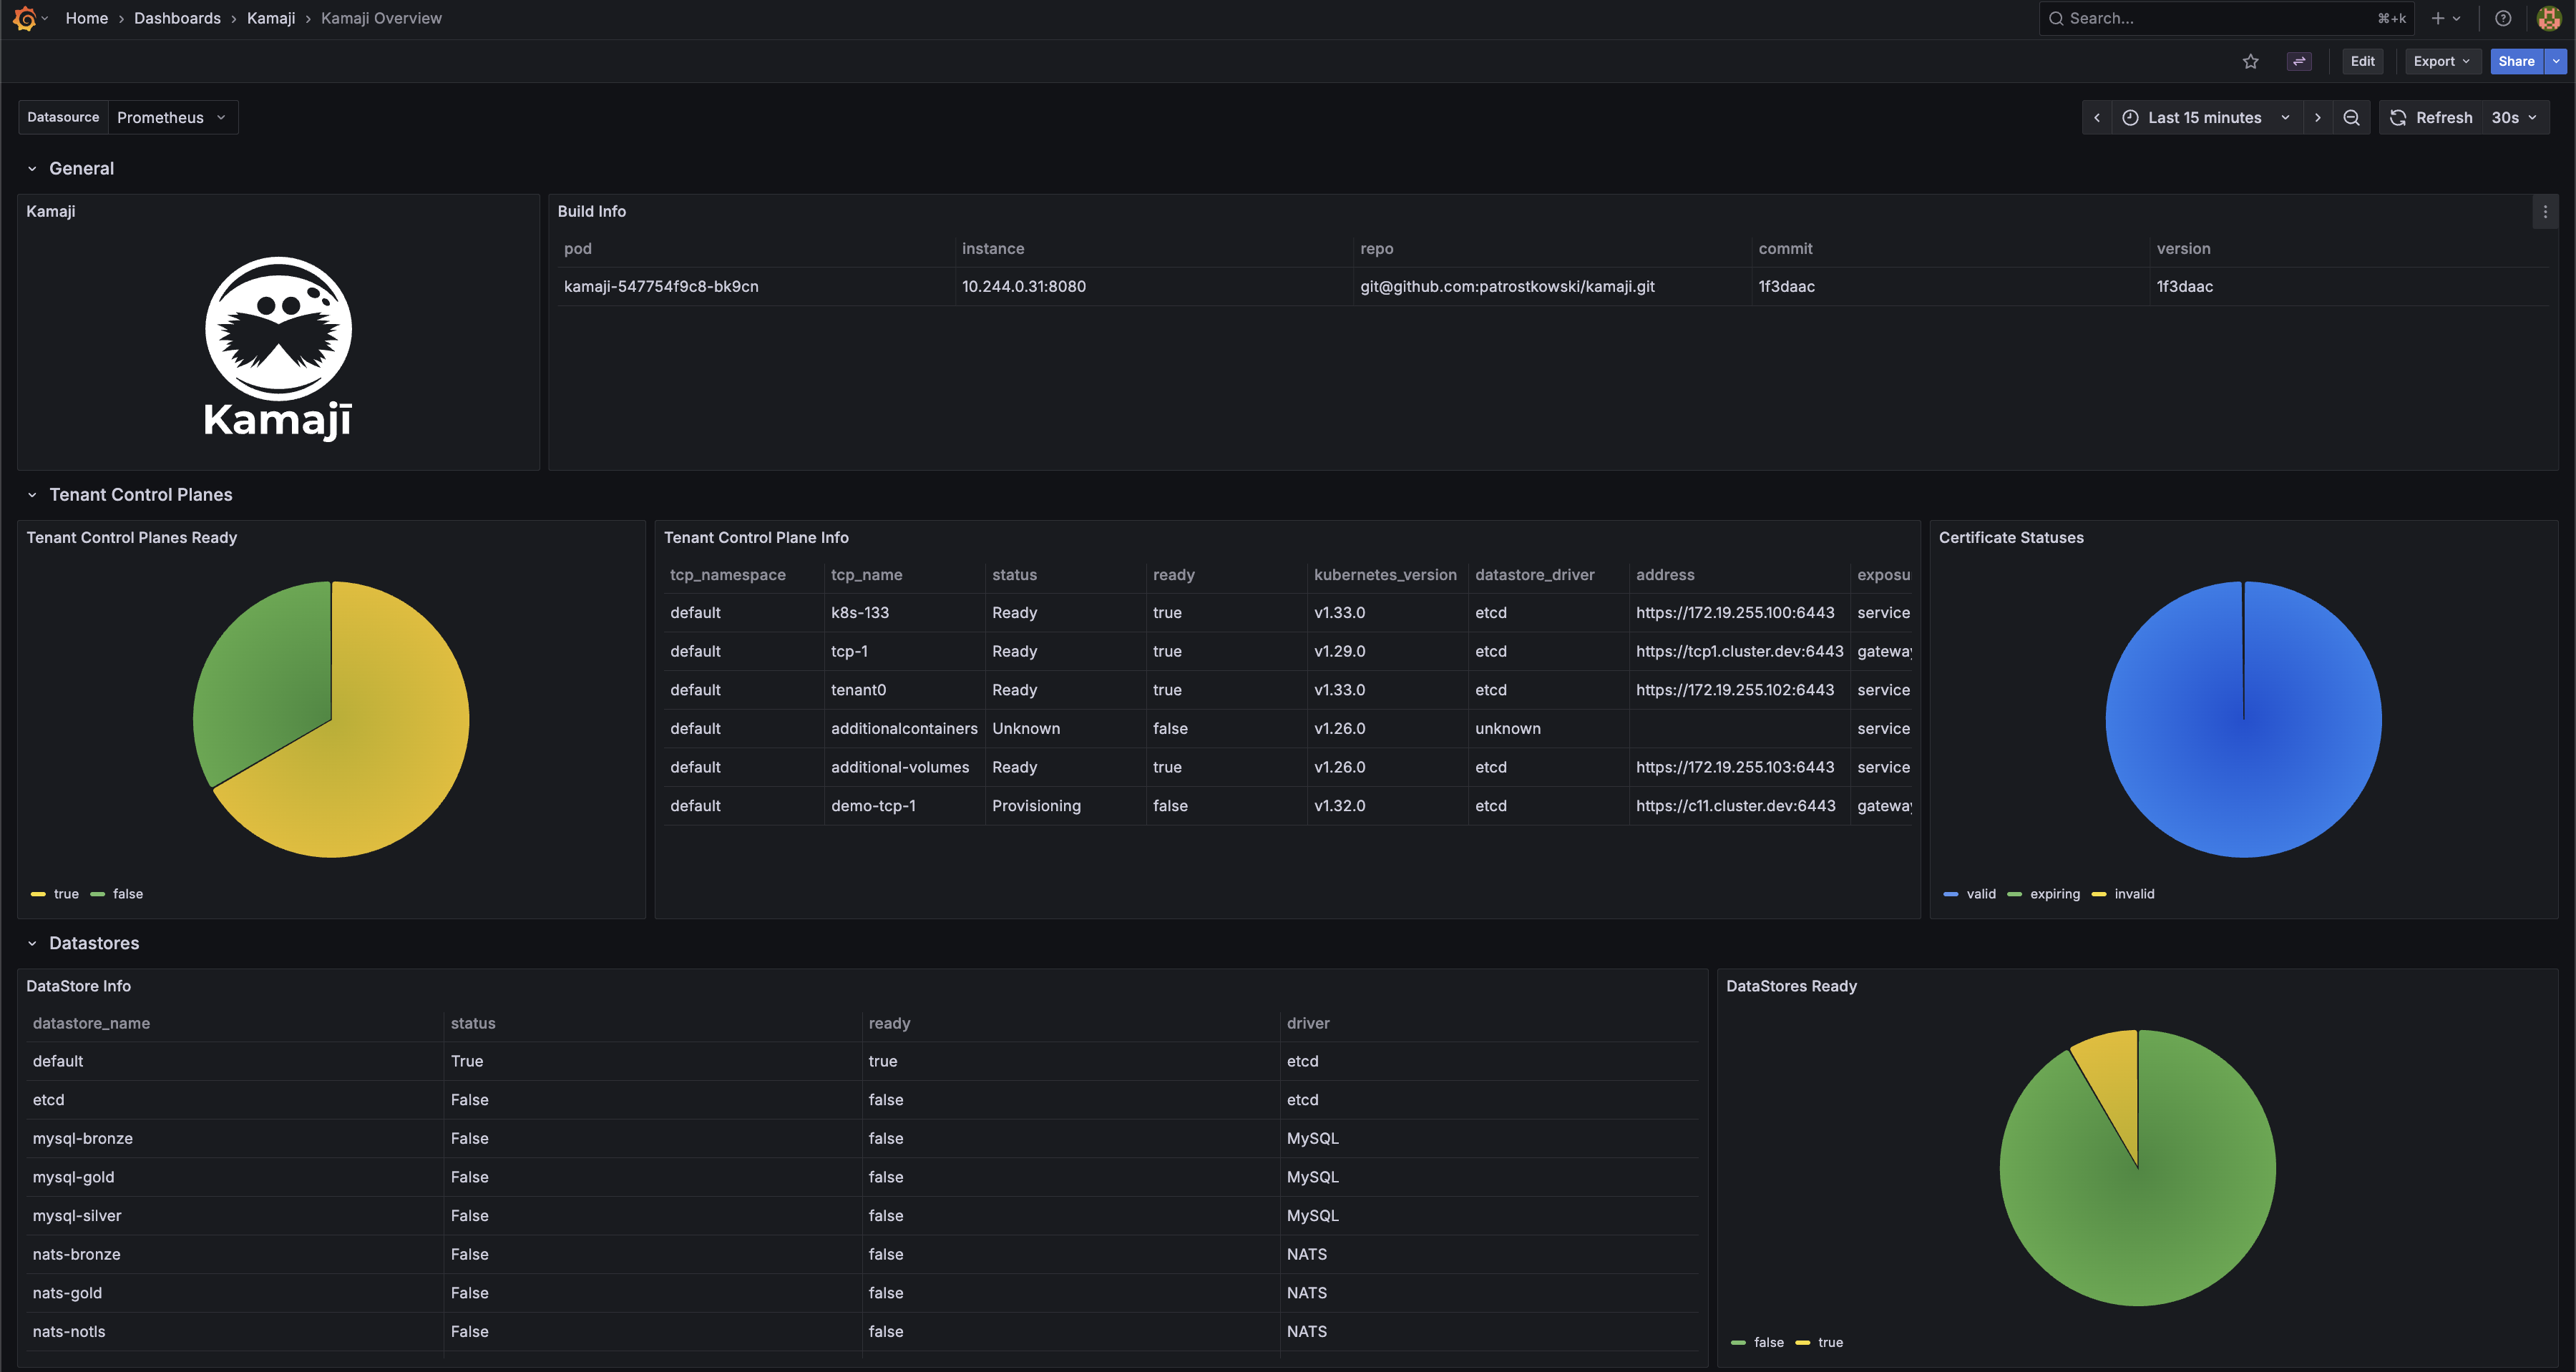
Kamaji exposes management-plane metrics from the controller-manager /metrics endpoint. You can scrape this endpoint with Prometheus and use the metrics to monitor TenantControlPlanes, DataStores, certificate lifecycle, handler latency, and build metadata.
The custom Kamaji metrics are:
kamaji_tenant_control_plane_infokamaji_tenant_control_plane_statuskamaji_tenant_control_planes_currentkamaji_datastore_infokamaji_datastore_statuskamaji_datastores_currentkamaji_certificates_currentkamaji_handler_time_secondskamaji_build_info
In addition, Kamaji also exposes the default Go runtime and controller-runtime metrics.
To enable scraping, create a ServiceMonitor like the following:
apiVersion: monitoring.coreos.com/v1
kind: ServiceMonitor
metadata:
  name: kamaji
  namespace: default
spec:
  namespaceSelector:
    matchNames:
      - kamaji-system
  selector:
    matchLabels:
      app.kubernetes.io/instance: kamaji
      app.kubernetes.io/component: metrics
  endpoints:
    - port: metrics
      path: /metrics
      interval: 15s
A ready-to-use Grafana dashboard for these metrics is available here.
Tenant Control Plane component metrics
Enable metrics scraping
On the Management Cluster, in the same namespace as the Tenant Control Plane, create a Service Monitor that instructs Prometheus how to scrape the metrics from the TCP.
First, create a service for exposing metric endpoints from TCP components. The following is an example for a Tenant Control Plane named charlie deployed in the default namespace:
apiVersion: v1
kind: Service
metadata:
  labels:
    kamaji.clastix.io/name: charlie-metrics
  name: charlie-metrics
  namespace: default
spec:
  ports:
  - name: kube-apiserver-metrics
    port: 6443
    protocol: TCP
    targetPort: 6443
  - name: kube-controller-manager-metrics
    port: 10257
    protocol: TCP
    targetPort: 10257
  - name: kube-scheduler-metrics
    port: 10259
    protocol: TCP
    targetPort: 10259
  selector:
    kamaji.clastix.io/name: charlie
  type: ClusterIP
Then create a Service Monitor that tells Prometheus how to scrape the metrics from the TCP:
apiVersion: monitoring.coreos.com/v1
kind: ServiceMonitor
metadata:
  labels:
    release: kube-prometheus-stack
  name: kube-prometheus-stack-tcp-charlie
  namespace: default
spec:
  endpoints:
  # API Server endpoint
  - port: kube-apiserver-metrics
    scheme: https
    path: /metrics
    interval: 15s
    scrapeTimeout: 10s
    tlsConfig:
      # skip certificate verification
      insecureSkipVerify: true
      # Client certificate for authentication
      cert:
        secret:
          name: charlie-api-server-kubelet-client-certificate
          key: apiserver-kubelet-client.crt
      # Client key for authentication
      keySecret:
        name: charlie-api-server-kubelet-client-certificate
        key: apiserver-kubelet-client.key
    metricRelabelings:
    - action: drop
      regex: apiserver_request_duration_seconds_bucket;(0.15|0.2|0.3|0.35|0.4|0.45|0.6|0.7|0.8|0.9|1.25|1.5|1.75|2|3|3.5|4|4.5|6|7|8|9|15|25|40|50)
      sourceLabels:
      - __name__
      - le
    relabelings:
    - action: replace
      targetLabel: cluster
      replacement: charlie
    - action: replace
      targetLabel: job
      replacement: apiserver
  # Controller Manager endpoint
  - port: kube-controller-manager-metrics
    scheme: https
    path: /metrics
    interval: 15s
    scrapeTimeout: 10s
    tlsConfig:
      # skip certificate verification
      insecureSkipVerify: true
      # Client certificate for authentication
      cert:
        secret:
          name: charlie-api-server-kubelet-client-certificate
          key: apiserver-kubelet-client.crt
      # Client key for authentication
      keySecret:
        name: charlie-api-server-kubelet-client-certificate
        key: apiserver-kubelet-client.key
    relabelings:
    - action: replace
      targetLabel: cluster
      replacement: charlie
    - action: replace
      targetLabel: job
      replacement: kube-controller-manager
  # Scheduler endpoint
  - port: kube-scheduler-metrics
    scheme: https
    path: /metrics
    interval: 15s
    scrapeTimeout: 10s
    tlsConfig:
      # skip certificate verification
      insecureSkipVerify: true
      # Client certificate for authentication
      cert:
        secret:
          name: charlie-api-server-kubelet-client-certificate
          key: apiserver-kubelet-client.crt
      # Client key for authentication
      keySecret:
        name: charlie-api-server-kubelet-client-certificate
        key: apiserver-kubelet-client.key
    relabelings:
    - action: replace
      targetLabel: cluster
      replacement: charlie
    - action: replace
      targetLabel: job
      replacement: kube-scheduler
  selector:
    matchLabels:
      kamaji.clastix.io/name: charlie-metrics
TLS certificates
To access metrics endpoints, the Prometheus must authenticate with the control plane endpoints. You can use the <tcp_name>-api-server-kubelet-client-certificate secret. This secret is automatically created by Kamaji in the namespace and contains the client certificate and key needed for the control plane components.
Finally, ensure the Prometheus service account, e.g. kube-prometheus-stack-prometheus has the necessary permissions to access the secret containing the certificates. The following is an example of a ClusterRole and ClusterRoleBinding that grants the required permissions:
apiVersion: rbac.authorization.k8s.io/v1
kind: RoleBinding
metadata:
  name: prometheus-secret-access
  namespace: default
subjects:
- kind: ServiceAccount
  name: kube-prometheus-stack-prometheus
  namespace: monitoring-system
roleRef:
  kind: Role
  name: prometheus-secret-reader
  apiGroup: rbac.authorization.k8s.io
---
apiVersion: rbac.authorization.k8s.io/v1
kind: Role
metadata:
  name: prometheus-secret-reader
  namespace: default
rules:
- apiGroups: [""]
  resources: ["secrets"]
  verbs: ["get", "list", "watch"]
For production environments, a fined grained approach is recommended to restrict access only to the secrets containing the required certificates.
Accessing metrics
Scraped metrics are available in the Prometheus server. You can access the Prometheus dashboard to view the metrics and create alerts based on them. If you use the same Prometheus instance for monitoring both the Management Cluster and Tenant Control Planes, you must relabel the scraped metrics to differentiate between them. This can be achieved in the values.yaml file used to install the Prometheus Operator Helm Chart:
...
prometheus:
...
kubeApiServer:
    serviceMonitor:
    relabelings:
    - action: replace
        targetLabel: cluster
        replacement: kamaji
kubeControllerManager:
    serviceMonitor:
    relabelings:
    - action: replace
        targetLabel: cluster
        replacement: kamaji
kubeScheduler:
    serviceMonitor:
    relabelings:
    - action: replace
        targetLabel: cluster
        replacement: kamaji
...
Grafana
Grafana is a widely used tool for visualizing metrics. You can create custom dashboards for Tenant Control Planes and visualize the metrics scraped by Prometheus. When using kube-prometheus-stack, Grafana can also be installed with a set of predefined dashboards for Kubernetes Control Plane components: kube-apiserver, kube-scheduler, and kube-controller-manager. These dashboards can serve as a starting point for creating custom dashboards for Tenant Control Planes or can be used as-is, provided that the scraped metrics use the labels expected by those dashboards.
Multi-Cluster Mode
When using the predefined kube-prometheus-stack dashboards to visualize multiple Tenant Control Planes, enable the multi-cluster dashboard mode in the chart values:
yaml
grafana:
  sidecar:
    dashboards:
      multicluster:
        global:
          enabled: true
This exposes the cluster variable in the dashboards. Each Tenant Control Plane ServiceMonitor should relabel scraped metrics with a unique cluster value, for example the Tenant Control Plane name, and with the standard Control Plane job labels expected by the dashboards: apiserver, kube-scheduler, and kube-controller-manager.
That's it!